

 By Legal Futures Associate Auto Claims Assist
Over the past six years, the UK motor‑claims landscape has changed. New analysis from Auto Claims Assist, based on 31,299 non‑fault claims handled between January 2019 and June 2025 and cross‑checked against data from the Association of British Insurers (ABI), the Driver and Vehicle Licensing Agency (DVLA) and the Office for National Statistics (ONS), reveals a clear pattern:
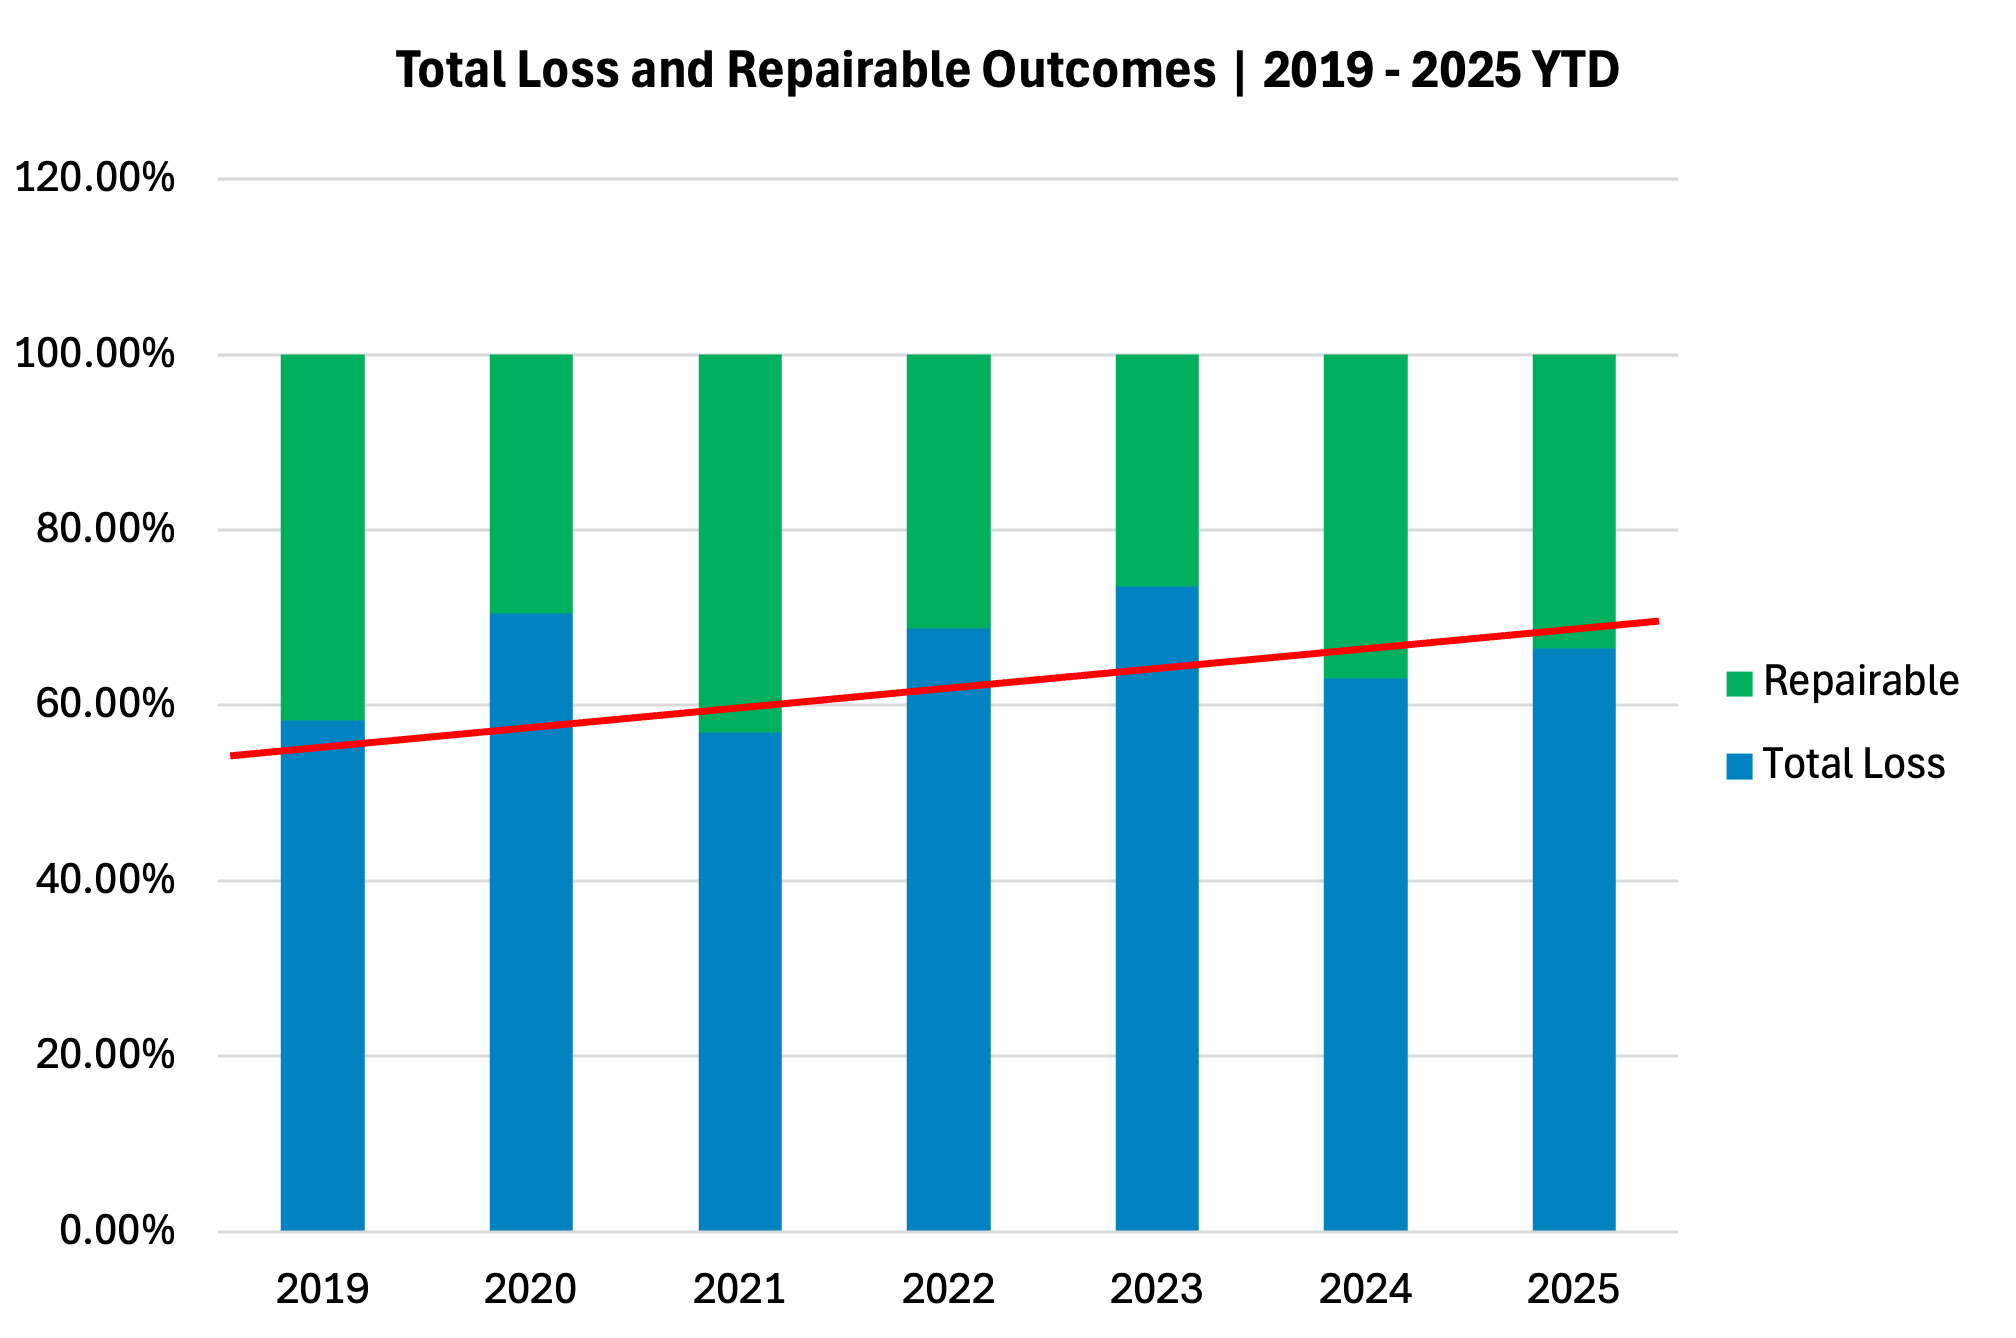
- Average repair costs have jumped 24.7 %, from £4,162 in 2019 to £5,191 year‑to‑date 2025.
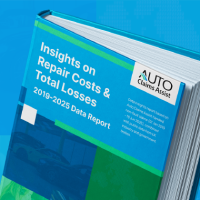
- Two‑thirds of damaged cars are now written off. The peak was Q3 2023, when the total‑loss rate briefly reached 73 %.
- Motor insurers paid out a record £11.7 billion in 2024 (ABI) – a 17 % year‑on‑year increase that inevitably feeds through to higher premiums.
Below, we unpack the forces behind the write‑off trend, the knock‑on effects for drivers and what you can do if you’re involved in a non‑fault accident.
Year | Avg. Repair Cost | Total‑Loss Rate | Repairable Rate |
2019 | £4,162 | 58.3 % | 41.7 % |
2020 | £4,625 | 70.5 % | 29.5 % |
2021 | £3,597 | 57.0 % | 43.0 % |
2022 | £4,128 | 68.8 % | 31.2 % |
2023 | £4,628 | 73.6 % (peak) | 26.4 % |
2024 | £5,147 | 63.1 % | 36.9 % |
2025 YTD | £5,191 | 66.5 % | 33.5 % |
Source: Auto Claims Assist proprietary claims data, 2019‑2025
Three forces driving today’s market pressures
1. Rising parts and energy costs
A bodyshop can only repair a vehicle if the numbers stack up. Unfortunately, they increasingly do not:
- A representative “basket” of common parts rose 35 % in price between 2020 and 2024 .
- Business electricity costs in late 2024 were 75 % higher than in early 2021 .
- Extended parts lead‑times – still affected by post‑Brexit customs checks and global supply‑chain disruption – add days to repair cycles and increase the bill for replacement vehicles.
As repair cost approaches a vehicle’s pre‑accident value (PAV), an insurer will usually declare a total loss. So every pound that energy or parts inflation adds to an estimate nudges more claims over that threshold.
2. A shortage of skilled technicians
The Institute of the Motor Industry (IMI) reported 23,000 vacancies across the aftermarket in 2024 ³. Skills shortages translate directly into higher labour rates and longer queues. Less capacity also makes it harder for insurers to secure timely repair slots, another factor that tips marginal cases into write‑offs.
3. Ever‑more complex vehicles
Electric vehicles (EVs) and cars packed with advanced driver‑assistance systems (ADAS) are positive for safety and emissions, but they are harder – and costlier – to fix:
- Only 22 % of UK technicians are fully EV‑qualified, and just 2 % hold formal ADAS calibration certification .
- Research shows EVs can cost up to 25 % more and take 14 % longer to repair than comparable petrol or diesel cars .
Battery modules, radar sensors and 360‑degree camera arrays drive up both parts prices and labour hours. On lower‑value models a minor collision is now enough to trigger a total‑loss decision.
Who gets written off? A look at the brands
Auto Claims Assist’s data shows a pronounced split between manufacturers.
- Renault now heads the table, with 8 in 10 non‑fault claims (80 %) ending in a total‑loss decision, closely followed by Citroën, Vauxhall and Fiat – all near the 79 % mark. These brands typically have lower pre‑accident values and parts that are disproportionately costly relative to resale price, so even moderate damage tips them into write‑off territory.
- Mid‑range makes such as Ford, Seat and Nissan still see around seven in ten cars written off, underscoring how widespread the issue has become.
- At the other end of the spectrum, premium manufacturers with strong residuals – Mercedes‑Benz (39 %), Land Rover (44 %) and Audi (55 %) – are far less likely to be declared uneconomic to repair. The gap from top to bottom of the list is now more than forty percentage points, but write‑off rates remain elevated across virtually every major brand.
Rank | Make | Total-loss % |
1 | Renault | 80.18% |
2 | Citroën | 79.56% |
3 | Vauxhall | 79.30% |
4 | Fiat | 78.95% |
5 | Honda | 78.10% |
6 | Peugeot | 77.69% |
7 | Ford | 71.88% |
8 | Seat | 71.76% |
9 | Nissan | 69.80% |
10 | Skoda | 66.13% |
11 | Toyota | 65.54% |
12 | Volkswagen | 64.85% |
13 | Hyundai | 64.29% |
14 | MINI | 63.16% |
15 | Jaguar | 62.65% |
16 | Volvo | 61.83% |
17 | BMW | 56.51% |
18 | Audi | 55.41% |
19 | Land Rover | 43.91% |
20 | Mercedes-Benz | 39.49% |
Source: Auto Claims Assist proprietary claims data, 2019‑2025
Linking our data to the national picture
Auto Claims Assist’s micro‑level view dovetails with the macro facts:
- £11.7 billion paid out by UK motor insurers in 2024 (ABI).
- 562,185 vehicles written off in 2024 (DVLA FOI) – roughly one every minute. (Source: Allegiant)
Our figures help explain why those headlines are happening. When two‑thirds of non‑fault claims already end as total losses inside a single accident‑management portfolio, industry‑wide costs inevitably spike.
What this means for drivers
- Higher premiums – The average private‑motor policy cost £622 in 2024, up 15 % on the year (ABI).
- More valuation disputes – The Financial Ombudsman Service reports a 38 % rise in car/motorcycle insurance complaints, many centred on settlement values. Drivers with outstanding finance are especially exposed: a low PAV can leave you repaying a loan for a car you no longer possess.
Five practical steps if you are not at fault
- Document everything at the scene – Photos, dash‑cam footage and independent witness details remain invaluable. Know what to do at the accident scene.
- Check comparable sale prices – Before accepting an insurer’s offer, look at like‑for‑like vehicles advertised locally and online.
- Challenge low PAVs with evidence – Provide mileage, service history and optional‑extras details that support a higher figure.
- Consider independent accident‑management support – An accident management specialist can arrange a comparable replacement vehicle, liaise with engineers and negotiate directly with the third‑party insurer.
- Act quickly – Storage charges and salvage disposal progress rapidly once an insurer issues a total‑loss notice.
How Auto Claims Assist supports non‑fault drivers
Auto Claims Assist act solely for the non-fault driver, not the insurer:
- Benchmarks valuations against live market data rather than generic pricing guides.
- Arranges a comparable replacement vehicle from day one, so you are never off the road.
- Manages recovery, storage, insurer liaison and every stage of the claim – freeing you to focus on getting back on track.
To explore the full 2019‑2025 write off trend data report, visit the Insights **Resource Hub:** https://www.autoclaimsassist.co.uk/resource/insights/