 Land ownership by domestic corporate and commercial entities amounts to 3,106 square metres (m²) – equivalent to three five-a-side football pitches or 12 tennis courts[1] – for every household in England and Wales, according to new analysis by Search Acumen [1], the property data and technology provider.
Findings from HM Land Registry data covering nearly 500,000 registrations and over 11.5 million acres of land, combined with population data from the Office for National Statistics (ONS), show nearly a third (31%) of England and Wales is held by domestic corporate and commercial owners.
These include limited companies and PLCs; corporate bodies; local authorities; county councils; industrial and provident societies; unlimited companies; registered society companies; and housing associations or societies.
South East is home to the largest domestic corporate and commercial land mass
Comparing between regions, the South East has the largest area of land (2.25m acres) under domestic corporate and commercial ownership. This accounts for nearly a fifth (19%) of all such land across England and Wales.
The South East is home to over 676,000 more acres of corporate and commercial land than the next most prominent region (the North East, with 1.57m acres), and more than ten times the amount held in Greater London (203,645 acres).
North East features highest concentration of domestic corporate/commercial land
The South East, North East, East Midlands and London are all shown to have above-average percentages of land under domestic corporate and commercial ownership. Each of these regions also has a higher share of corporate/commercial land than of total land across England and Wales.
From Search Acumen’s analysis, the North East emerges with the biggest concentration of such land, both compared to the size of the region and to its resident population. Nearly three quarters (74%) of all land in the North East is owned by domestic corporate or commercial interests: more than twice the average for England and Wales (31%). This adds up to 7,387m² for every household: roughly equivalent in size to the region’s major football pitches.[2]
Wales features the next largest amount of corporate and commercially owned land per household (5,870m²), followed by the East Midlands (3,544m²). Greater London ranks lowest by this measure, with domestic corporate and commercial entities owning just 286m² per household. At 94m² per person, this still equals the size of the average home sold across England and Wales (90m² according to the latest data[3]).
Table 1: Land held by domestic corporate and commercial entities by region in England and Wales, ranked by ownership per household/person in the region (highest to lowest)
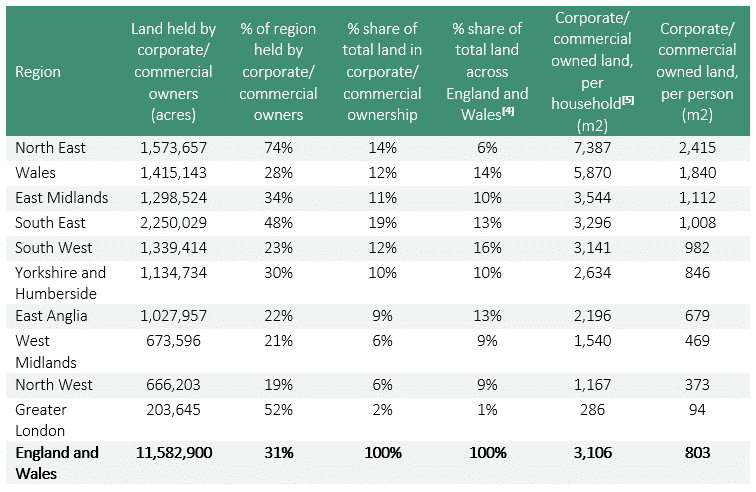
Source: HM Land Registry / ONS / Search Acumen
Limited companies and PLCs most established in the East Midlands; local authorities hold 40% of corporate and commercial land in Greater London
Search Acumen’s analysis also shows how the profile of domestic corporate and commercial ownership differs significantly from one region to the next. Limited companies and PLCs hold 48% of this land across England and Wales, while corporate bodies own 37%, local authorities own 10% and county councils own 3%. The remainder is divided between industrial and provident societies, unlimited companies, registered society companies, and housing associations or societies.
Beneath the national figures, there are notable regional differences in the share of land ownership by different types of entities. Limited companies and PLCs are most firmly established in the East Midlands, where they account for three fifths (60%) of domestic corporate and commercial land holdings.
Two fifths (40%) of corporate and commercial land holdings in London are owned by its 33 local authorities: four times the average of 10% across England and Wales. East Anglia’s county councils hold twice the share of corporate and commercial land in the region (6%) as their counterparts across England and Wales as a whole (3%).
Corporate bodies in Wales (55%) and the North East (53%) also have significantly higher shares of corporate and commercial ownership than the nationwide average (37%).
Graph 1: Share of domestic corporate and commercial land ownership, England and Wales
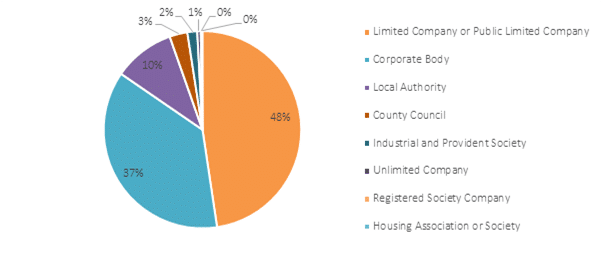
Source: HM Land Registry / Search Acumen
Top landowners own almost a tenth of England and Wales
The data suggests that the ten largest corporate and commercial landowners[6] account for more than a quarter (29%) of all domestic corporate and commercially owned land. This adds up to 3.39 million acres, or 9% of all land across the whole of England and Wales.
These major-league land owners include: HRH The Queen, via the Crown and Duchy of Lancaster; the National Trust; the Church Commissioners for England; the Secretary of State for Environment, Food and Rural Affairs; the Secretary of State for Defence; the National Assembly for Wales; United Utilities Water, Highways England; Welsh Water; and MRH Minerals.
Andrew Lloyd, Managing Director of Search Acumen, commented:
“Increasing access to property data is dramatically improving our understanding of land ownership across the country. The insights it reveals can have important implications and benefits for planning and development in both residential and commercial markets on a local level, from housing to infrastructure projects.
“While the South East holds the lion’s share of domestic corporate and commercially owned land, the importance of the ‘Northern Powerhouse’ and ‘Midlands Engine’ is clearly visible in the major land holdings by business interests in these areas. Further south, as the London property market continues to struggle to meet demand, there is likely to be ongoing pressure on its landowners to find more space for new housing as well as commercial developments.
“The drive towards data access and the digitisation of the property market will also revolutionise how everyone involved – from developers to estate agents to law firms to buyers and sellers themselves – understands and manages the transaction process.
“Government has joined consumers in calling for a more streamlined experience[7] that relieves the age-old pain points in buying and selling property. Data and technology can now equip property and legal professionals with real-time insights to advise their clients and inform buying decisions – turning what might once have been dismissed as science fiction into a working reality.
“Access to this kind of data is the latest sign of a sea-change that heralds an exciting and innovative future, where the mechanics of the property market are no longer held back by the limits of thinking and technology from yester-year.”
[1] Fédération Internationale de Football Association (FIFA) rules specify the maximum side of a five-a-side football pitch is 30m x 35m = 1,050m². International Tennis Federation (ITF) rules specify dimensions of a doubles tennis court as 23.77m x 10.97m = 260.8m²
[2] St James’ Park, Newcastle, and the Stadium of Light, Sunderland, both measure 7,140 m² while the Riverside Stadium, Middlesbrough, measures 7,245m². Football’s world governing body FIFA establishes that the length of a regulation football pitch must be between 90m and 120m and the width not less than 45m and not more than 90m (i.e. between 4,050m² and 10,800m²).
[3] Office for National Statistics, House price per square metre and house price per room, England and Wales: 2004 to 2016 [3], 11 October 2017
[4] Office of National Statistics, 2011 Census: Population density, local authorities in the United Kingdom [4]
[5] Office of National Statistics, Live tables on household projections: 2014 [5]
[6] Analysis is by registered name and therefore does include any land holdings registered in a separate name